Insight: Comparing predictive ability in presence of instability over a very short time
Publication
The paper Comparing predictive ability in presence of instability over a very short time, co-authored with my former Ph.D. advisors Fabrizio Iacone and Luca Rossini, is now published in The Econometrics Journal.
Abstract
We consider forecast comparison in the presence of instability when this affects only a short period of time. We demonstrate that global tests do not perform well in this case, as they were not designed to capture very short-lived instabilities, and their power vanishes altogether when the magnitude of the shock is very large. We then propose and discuss approaches that are more suitable to detect such situations, such as nonparametric methods like the S test from Andrews (2003) or the MAX procedure from Harvey et al. (2021). We illustrate these results in a Monte Carlo exercise and in a comparison of the nowcast of the quarterly US nominal GDP from the Survey of Professional Forecasters (SPF) against a naive benchmark of no growth, over a period that includes the GDP instability brought by the COVID-19 crisis. We recommend that the forecaster does not pool the sample, but excludes the short periods of high local instability from the evaluation exercise.
Motivation
Predictive ability tests can be misleading in the presence of short and deep shocks. To see why, consider the nowcasts for U.S. Nominal GDP growth from the Survey of Professional Forecasters (SPF) versus a naïve, zero-growth benchmark.
Figure 1: U.S. nominal GDP growth (black dotted line), GDP nowcast from the SPF (blue line), and naïve nowcast (red line) over the period 2000:Q1 to 2020:Q3.
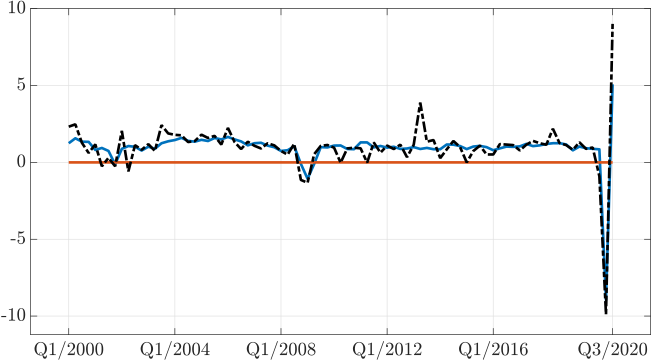
As the figure and RMSE metrics in the table below suggest, the SPF is more accurate than the naïve benchmark, even during the COVID-19 crisis. Surprisingly, however, predictive ability tests like the Diebold-Mariano and Fluctuation tests fail to find any significant difference between the two forecasts.
Table 1: RMSE_SPF and RMSE_Naïve are the average RMSE for the SPF and naïve benchmark, respectively. Ratio refers to the ratio RMSE_SPF/RMSE_Naïve. DM, Fl_l, and Fl_u are the Diebold and Mariano (1995), and lower and upper Fluctuation test (Giacomini and Rossi, 2010) statistics. The 5% critical values for two-sided tests are 2.032 (fixed smoothing) and 3.012, respectively.
| Period | RMSE_SPF | RMSE_Naive | Ratio | DM | Fl_l | Fl_u |
|---|---|---|---|---|---|---|
| Q1:2000 — Q4:2019 | 0.37 | 1.66 | 0.22 | -7.27 | -5.83 | -2.04 |
| Q1:2000 — Q3:2020 | 0.59 | 3.77 | 0.16 | -1.92 | -2.49 | -0.21 |
In the paper, we show this happens because the power of tests like Diebold-Mariano or the Fluctuation test vanishes when instability is very short-lived, even if the shock is very large. Consequently, forecasters pooling data might wrongly conclude that their forecasts are not more accurate than a naïve benchmark.
To address this issue, we propose using tests better suited for detecting short-lived instabilities, such as the S test from Andrews (2003) or the MAX procedure from Harvey et al. (2021). These tests are designed to capture local instabilities and have power in these situations.
Replication package
All replication files are available in my GitHub repository, where you can find implementations of the predictive ability tests discussed in the paper, including:
- Diebold and Mariano (1995)
- Fluctuation (Giacomini & Rossi, 2010)
- S (Andrews, 2003)
- MAX (Harvey et al., 2021)
Running the main files will reproduce all results. We use the S and MAX tests specifically to assess predictive ability over very short periods. Please consult the README for complete details.